













What Is Data-Driven Instruction? How to Identify Students Who Need Support Today
Data-driven instruction does not start from a data table
Data-driven instruction: is a teaching method based on student learning data to make appropriate decisions. Instead of relying solely on gut feeling, teachers use test results, each student's academic progress, and engagement levels to determine who needs support, what content needs review, and what the next teaching step should be.
Imagine the first 10 minutes of a teacher's day. In the class, there is a student who has just received a low score, a student who is behind in progress, an essay that has been waiting to be graded for too long, and an assessment that is still locked. At the same time, another student logged in for nearly two hours but completed almost no activities. If only looking at the average score of the class, it is difficult for teachers to know which cases need to be prioritized first.
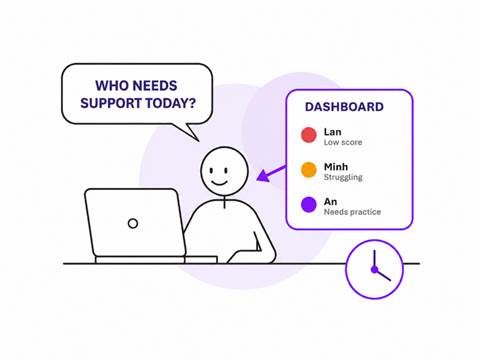
A classroom situation: same low score but not the same cause
Two students can score 55% on the same test but need two completely different types of support. One student worked steadily, reviewed the lesson, and only got stuck on one specific skill. The other student was several days behind schedule, skipped the instructional video and submitted the assignment very quickly. The scores are the same, but the cause and urgency are not the same.
Situations that often cause teachers to need to read data in context include:
1. Students have low scores but are still on schedule and participate regularly.
2. Students have okay scores but are falling behind their target date.
3. The student cannot continue because the assessment is locked or the retake has expired.
4. An essay waiting to be graded causes the entire process behind it to stall.
5. Students log in for a long time but have low active time, high idle time or few completed activities.
6. Students finish unusually quickly, need to check engagement and academic integrity.
Therefore, progress monitoring should not stop at seeing who has red points. Teachers need to juxtapose data to distinguish students who “don't understand yet,” students who “don't have a chance to continue,” students who are “disconnected,” and students who “need immediate feedback.” This is the starting point of a prioritized intervention process.
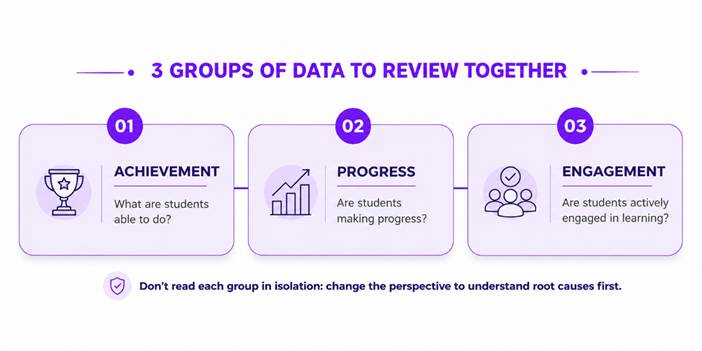
Three groups of data need to be viewed together: achievements, progress and engagement
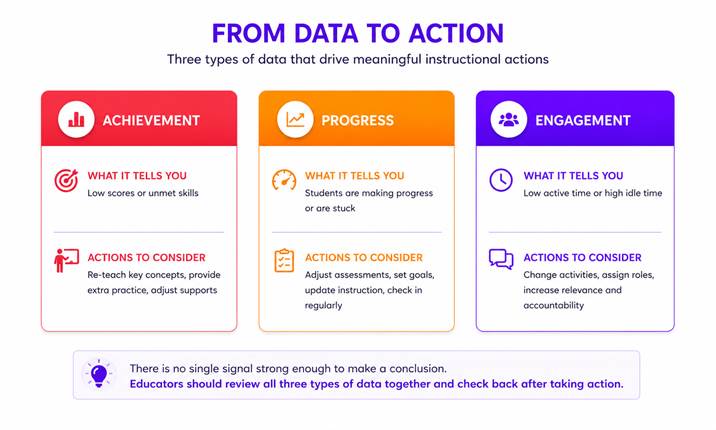
A useful teacher dashboard needs to help teachers see three groups of information simultaneously. Achievement indicates academic results; progress indicates where the student is on the route; also engagement indicates how you are using your study time. When separating each group, teachers easily draw conclusions without context.
These three groups of data can be understood according to the following simple questions:
1. Achievement - What do students understand and do? Assignment scores, assessments, skill proficiency levels, and work quality help teachers identify content students have mastered or misunderstood. However, a single low score is not enough to determine the cause.
2. Progress - Are students on the right path? Completion rate, overdue activity, target date, and distance from expected progress indicate whether the student is at risk of not completing the course. There are students who understand the lesson but are slow because an assignment is pending.
3. Engagement - Are students really engaged? Attendance, session log, active time, review time and idle time help teachers distinguish "logged in" from "learning". This is especially important data in blended learning, virtual learning or classes with a large amount of self-study time.
4. Cross-read data: low score + high active time may indicate that the student has tried but needs re-teaching. Low scores + low active time may indicate participation problems. Slow progress + work to high grade can be a bottleneck in the grading flow and not entirely due to the student.
5. Formative data is valuable because it allows teachers to act before final results become too late. Instead of waiting for a big test, teachers can use small, continuous signals to adjust study groups, reteach content, duration of support, or assignment style.
It is important not to turn the data into permanent labels. “Slow progress”, “low score” or “high idle time” are just signals to ask questions, not conclusions about the student's ability or attitude. Teachers still need to talk to students and consider the context before deciding.
A practical approach is to require each alert to be accompanied by two steps: verify the cause and select a testable action. The data-driven instruction then becomes a pedagogical loop instead of a report that is only opened during the meeting.
Signals that require action today
Not all data has the same urgency. Teachers and academic coordinators should agree on some priority signals to avoid spending too much time looking at the dashboard while still missing students who are stuck.
Repeated low scores or unsatisfactory skills: needs to check whether students are wrong about the same type of knowledge, lack the foundation, or do not understand the task requirements. Actions can be short reteaching, assigning supplementary lessons, or grouping support by skill.
Slow progress compared to target date: needs to determine the number of late activities, the recent completion rate, and the cause. A short catch-up plan, breaking down goals by day, is often more helpful than just saying “you're behind.”
Work to grade or waiting for feedback: is a signal that the school needs to handle because students may not know if they did the right thing or not. In some courses, ungraded papers also become a bottleneck that interrupts the learning process.
Assessment is locked or retake is over: requires teachers to review previous results, determine whether students are ready or not and decide to unlock, give more opportunities, re-teach or discuss directly. Unlocking automatically without looking at the context can bypass the real need for support.
Unusual study time: logging in for a long time does not necessarily mean studying effectively
In an online learning environment, total login time easily creates the feeling that students are actively participating. However, the session log may show that the majority of the time is idle time, or that students continually move through activities without completing them. On the contrary, high review time can be a positive sign when students actively return to old knowledge.
Active time low: find out difficulty with concentration, equipment, or task suitability. Review time increased: checks whether students are consolidating knowledge or getting stuck. Completion speed is too fast: review the quality of work and signs of skipping content. No activity occurs: verify account, class schedule or personal obstacle.
A timing cue should not be used to mechanically assess student attitudes. Teachers need to compare scores, progress, types of activities and discuss directly. The goal of engagement data is to unlock timely support, not to increase the feeling of surveillance.
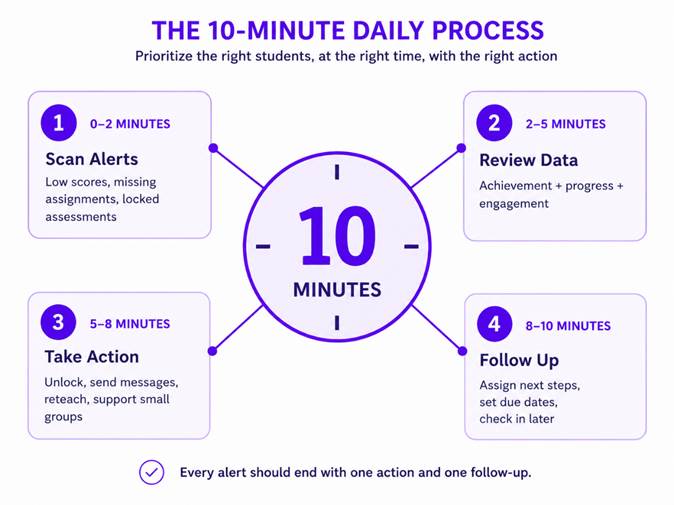
First 10 minutes of the day process to prioritize students in need of support
0-2 minutes - Warning scan: open the dashboard and only look at things that can block progress during the day: assessments that need to be opened, assignments waiting to be graded, students who have run out of retakes, activities that are overdue, or students who have unusual changes compared to the previous day.
2-5 minutes - Cross-read three groups of data: with each important warning, quickly view achievements, progress and engagement. The goal is not to analyze the entire record, but to examine whether the signal reflects knowledge difficulty, progress, engagement, or an operational problem.
5-8 minutes - Choose the smallest intervention that can create change: unlock assessment, grade a pending lesson, send test questions, reassign lessons, adjust target date, make an appointment with students or put them in a support group. Each student should have a clear action instead of a generic note.
8-10 minutes: finalize the person performing it and the time for rechecking
The intervention is only completed when someone is responsible and when the results are reviewed. Teachers can write short notes: "unlock and check again at the end of class", "assign supplementary lessons, watch mastery on Friday" or "talk to parents if there is no activity for 48 hours". This process helps the dashboard become an action list, not an endless warning screen.
Data is only valuable when it leads to specific pedagogical action. After intervention, teachers need to see what has changed: whether students continue the course, whether skill scores improve, whether active time increases, and whether they complete the agreed-upon small goals.
If an action doesn't create a transformation, that doesn't mean the data is useless. Teachers may need to re-hypothesize the cause, discuss further with students, or coordinate with academic counselors and families. Data-driven instruction is a process of continuous testing, observation, and adjustment, not a single decision based on a dashboard.
How do Educator Launchpad and Edgenuity/EdgeEX reports illustrate actionable data?
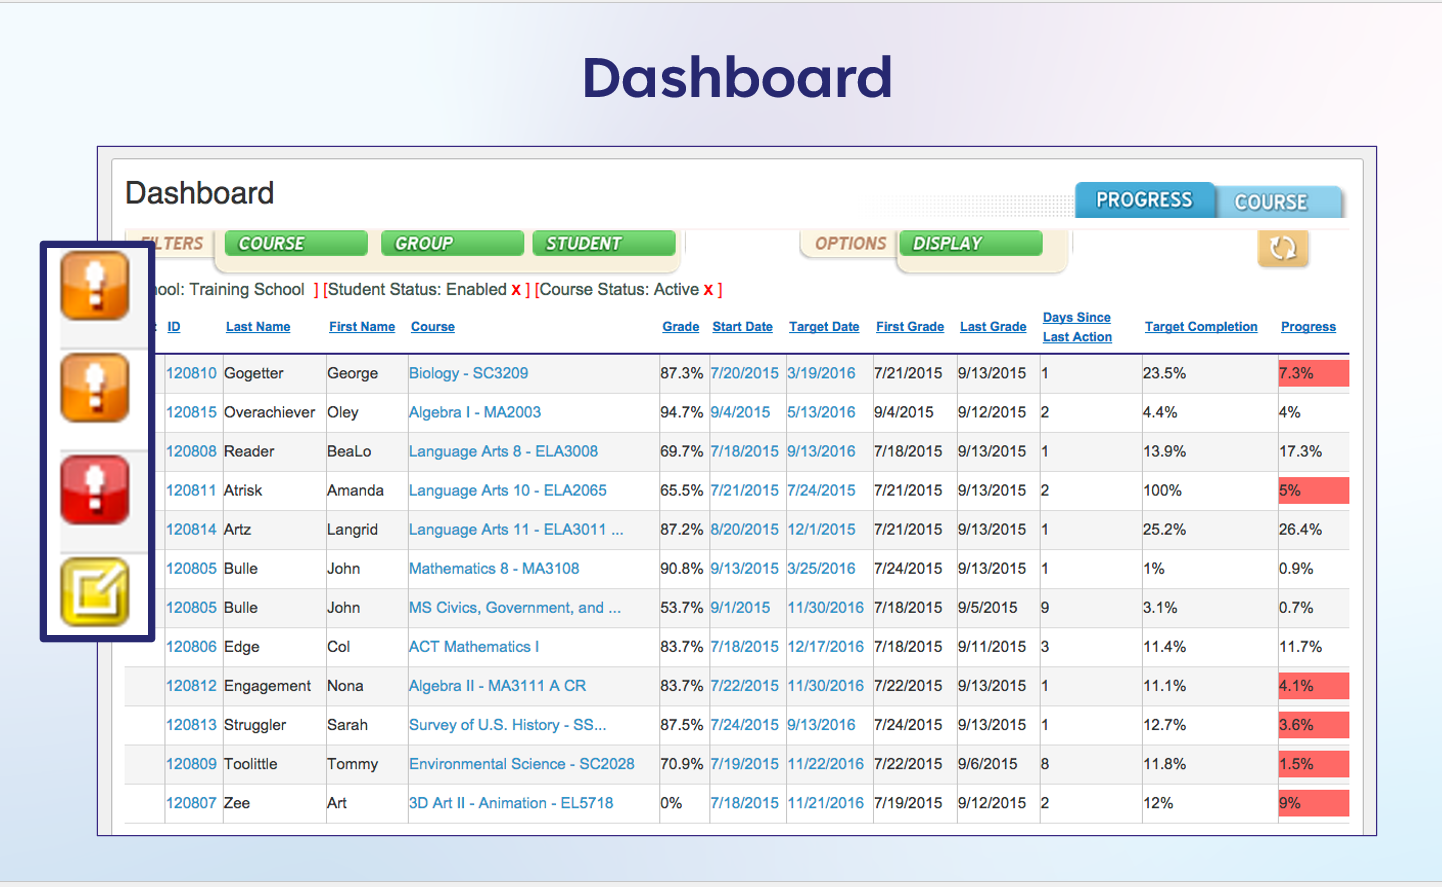
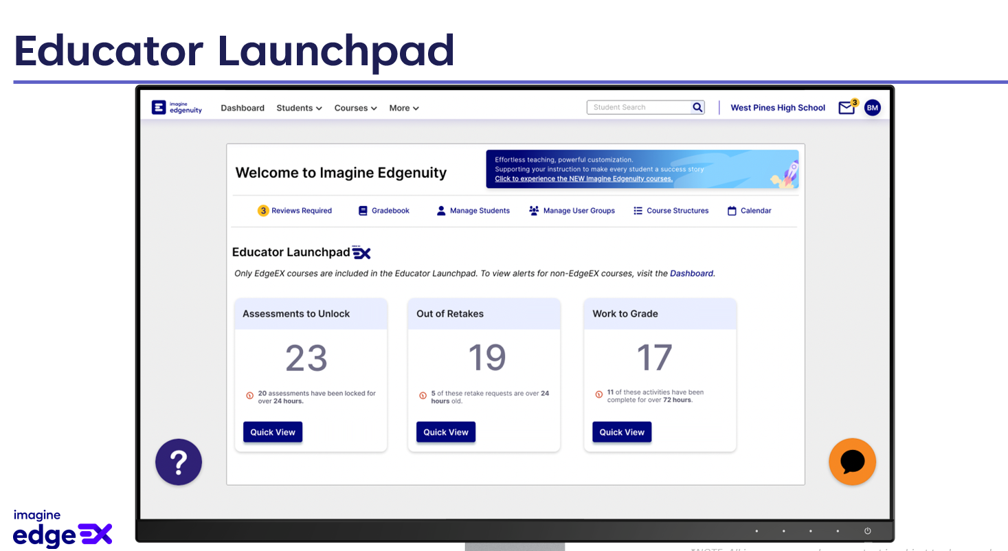
In Imagine EdgeEX, Educator Launchpad focuses on a number of things that need teachers' immediate attention, such as assessments to unlock, students out of retakes and work to grade. This layout illustrates the concept of actionable data: data tied to an actionable task, helping teachers prioritize faster instead of having to open multiple screens to manually find bottlenecks.
Achievement: Teachers can view scores, gradebooks and content mastery levels. Progress: progress reports show whether students are on schedule, behind schedule, or have unfinished activities. Engagement: Attendance Log and Session Log provide a view of active time, review time and idle time. When the three layers of information are collated, teachers have a better basis for choosing the type of intervention.
However, Edgenuity or EdgeEX does not resolve the cause behind a warning on its own. Dashboards can highlight students who need attention, but teachers still have to look at work, talk to students, consider the context, and decide on appropriate actions. The value of the tool lies in shortening the time to find information and bringing data closer to the daily workflow.
How to implement data-driven instructions without creating additional pressure?
A common mistake is asking teachers to track too many indicators, produce many reports but not agree on which indicators lead to which actions. This turns progress monitoring into a new class of administrative work. Schools should start with a few small questions: who is being blocked in progress, who is falling behind, and who has not responded after support.
The professional team can build a short “intervention menu” for each type of signal, such as reteaching in small groups, booster lessons, adjusting pacing, adding retakes, priority marking or family contact. Menus do not replace the teacher's decisions, but they help with consistent responses and reduce the time spent rethinking the process from scratch.
Student data also needs to be used responsibly. Do not publish rankings, label students based on a metric, or use active time as the sole evidence of hard work. Access rights, purpose of use and data retention period need to be clearly specified by the school.
A suitable pilot can start in a grade level in four to six weeks. The school tracks three outcomes: time from alert to intervention, percentage of students back on track, and how much teachers feel the dashboard helps them prioritize their work. The new process is then adjusted before scaling up.
Register for a free Trial account, demo book, quote:
Schools and teachers, please contact BooksVN, the designated distributor of Imagine Learning, in charge of countries including Vietnam, Philippines, Malaysia, Singapore, Hong Kong, Indonesia, India, Bangladesh, Cambodia, Laos, Japan and Taiwan through the following channels:
Website: www.booksvn.com Email: cs@booksvn.com
Mobile/WhatsApp: +84-915 920 514
Facebook: https://web.facebook.com/BooksVNeBooksachNgoaiVanchinhhang
Zalo OA: https://zalo.me/2230563715259512406


.svg)