













Which Student Assessment Platform Is Right for International and Bilingual Schools?
Why do international and bilingual schools need a different assessment?
Student capacity assessment software is not just a tool to create tests and return scores. For international and bilingual schools, the assessment system must also help the school address many questions at the same time: where students are at their grade level, what skills are lacking, how much growth the program is creating, and what teachers should do next after the results are available.
The biggest challenge lies in diversity. In the same class there may be students who use English as their first language, EAL/ELL students, students who have just transferred from the Vietnamese program, and students who have studied the international program for many years. Scores on a common test may indicate who did better, but it is unlikely that differences can be explained by subject knowledge, reading comprehension, academic vocabulary, or familiarity with the question format.
Schools also often operate many parallel programs: an international curriculum, supplementary content, intervention programs and internal assessment requirements. When each department uses a separate tool, data is easily fragmented. Teachers have to put together many tables of results, the curriculum coordinator has difficulty seeing trends between grade levels, and the school board lacks a unified picture to evaluate the quality of implementation.
Besides professional needs, schools also have to report to parents. Parents need to understand where their children are strong, what support they need and how they have progressed, instead of just receiving a total score without context. Therefore, a suitable system needs to turn assessment data into clear information that can be used in communication between teachers, academic leaders and families.
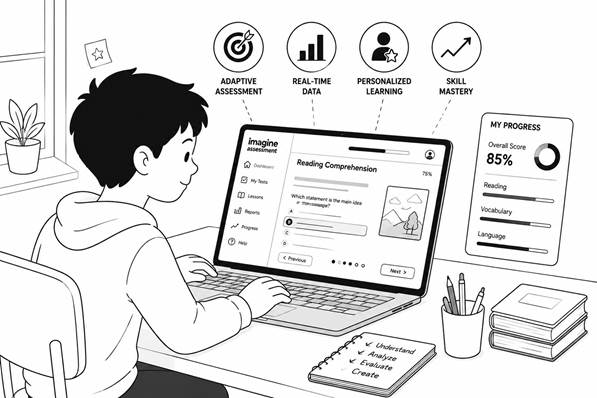
A set of criteria for selecting software to evaluate student capacity
There is no single tool that fits every field model. However, before viewing a demo or comparing quotes, schools can use the set of criteria below to eliminate options that are only "beautiful in interface" but do not have enough depth for professional work.
1. Grade level and subject coverage: does the system fully support the grades the school needs to implement or is it only suitable for a short period of time? Does the subject area meet the school's ELA, Math, early literacy or intervention needs?
2. Clear assessment purpose: does the tool distinguish between screening, diagnostic, benchmark and formative assessment or is it using one test for many different purposes?
3. Adaptability and accuracy: with diagnostic assessment, are questions adjusted according to student feedback to determine instructional level and needs by domain?
4. Standards alignment: are results linked to specific standards, domains, and skills so teachers know what content needs reteaching, intervention, or enrichment?
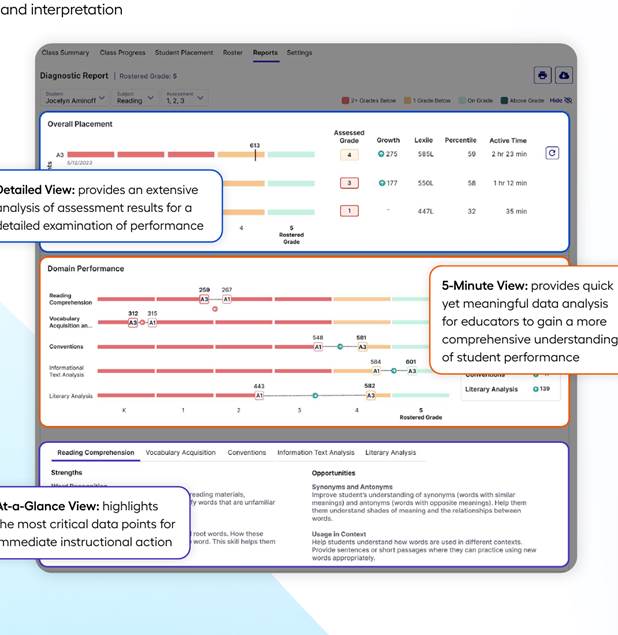
5. Multi-level reporting: teachers can view individual students and the whole class; curriculum coordinator can view grade, school or the entire system; Can administrators track growth and what impact the program is having?
6. Multilingual classroom support: does the system have test languages, accommodations, and implementation guidance appropriate for the school's students? Schools need to differentiate interface support, language support and validity of results for each group of students.
7. Data connectivity: needs to examine rosters, SSO, authorization, data export, API, SIS/LMS integration and how assessment data is transferred to learning programs or intervention tools.
8. Actual implementation: homework time, scheduling, equipment, headphones, microphone, training and the time teachers need to read reports must be consistent with the school's operating conditions.
The total score is not enough: data needs to go to domain, standard and next action
The tool only returns a total score that is usually consistent with the ranking goal or result recorded at a time. However, the total score does not tell teachers where students are struggling. Two students who both scored 65% may have completely different needs: one has weak vocabulary but is good at understanding text structure, while the other has good vocabulary but has not yet mastered inference or how to use evidence.
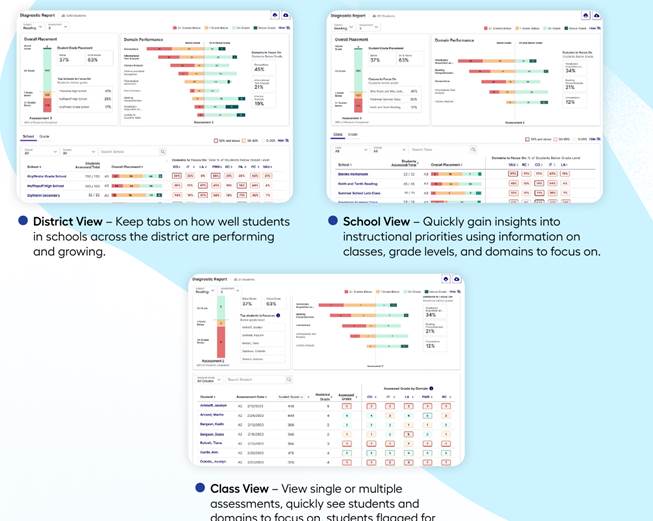
A system with actionable data needs to allow users to drill down from overall performance to domains, standards and items. At the grade level, teachers need to see which groups of students are at the Emerging, Developing, Approaching or Proficient level for each standard. At the individual level, the report should show assessed grade, domain strengths, learning gaps and growth across assessments.
The value of learning analytics is not in the number of graphs. The value lies in teachers being able to quickly answer three questions: “Who needs support?”, “What skills need support?” and “What is the next teaching step?”. If after opening the report, teachers still have to download many files, combine data and guess the cause, the software has not really reduced the load on the school.
Imagine+ Diagnostic is an example of a report that goes to the domain level, and provides At-a-Glance, 5-Minute, and Detailed Views. This organization addresses many uses: making quick decisions during the teaching day, analyzing trends in professional meetings, and looking deeply into data when developing intervention plans.
Standards alignment: need to ask the right questions before buying
“Is it standard or not?” is a necessary but not sufficient question. Schools should clearly ask which standards the system is following, whether the mapping is done at the domain level or each standard, whether the assessment content accurately reflects the difficulty of the curriculum being taught, and whether the report allows tracing results back to specific learning goals.
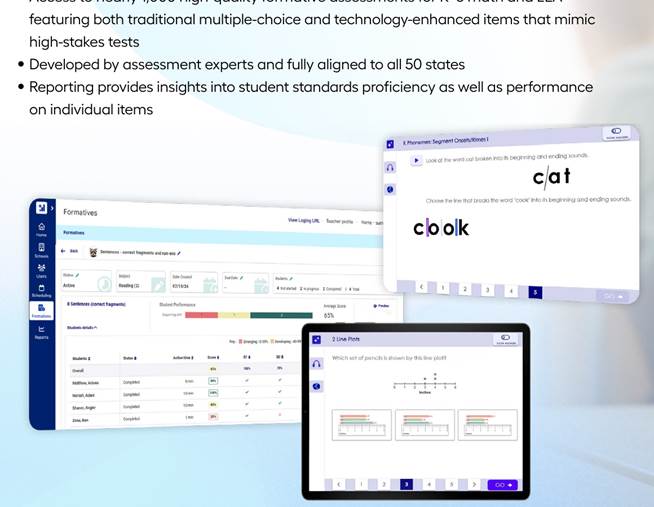
Imagine+ Formatives provides short, pre-constructed assessments for K–8 ELA and Math, with data by standard and item. Product documents say the Formatives warehouse has nearly 1,000 articles and is developed according to the standards of all 50 states in the United States. This is an advantage for schools that use US standards or a curriculum with a similar structure.
For schools following Cambridge, IB, Australian Curriculum, English National Curriculum or a specific framework, do not assume that “standards-aligned” means fully automatic alignment. The Curriculum coordinator needs to ask the provider to present the crosswalk, skill range, question difficulty, and how to use the data in the school's curriculum map. Without direct mapping, the system can still be useful for diagnostics or progress monitoring, but the roles must be clearly defined from the beginning.
Supporting multilingual students is more than just translating interfaces
In bilingual education, a low result may reflect a knowledge gap, a language barrier, or both. Therefore, schools need to check the language of questions, complexity of instructions, time taken, ability to read aloud, accommodation and interpretation of results for EAL/ELL students.
Imagine+ Assessment documents the full Spanish version of the Math Diagnostic, which assesses the Math skills of Spanish-speaking students without being overly influenced by language barriers. For Imagine+ Screener, the implementation guide also mentions that teachers can provide instruction in the local language in some situations. However, this is not a claim that the entire system supports every language. International and bilingual schools in Vietnam still need to specifically verify language, accommodation and suitability for their student group before implementing.
It is good practice to analyze results by group: students new to the school, EAL/ELL students, students in each previous program and students continuously in the system. This perspective helps schools avoid hasty conclusions that all score differences come from subject ability.
Data interoperability and program integration capabilities
Data interoperability is the ability of data to move and be used consistently between systems. For international schools, this is often the deciding point whether an assessment software becomes an everyday tool or just a "data oasis" opened a few times a year.
Before purchasing, IT/EdTech leads should check how to create and update accounts, roster sync, SSO, user roles, permissions by school/class, report export method, data retention period, security policy and ability to connect to the school's SIS, LMS or data warehouse. If the vendor doesn't yet support APIs or direct integration, schools need to know in what formats the data can be exported and who is responsible for cleaning the data.
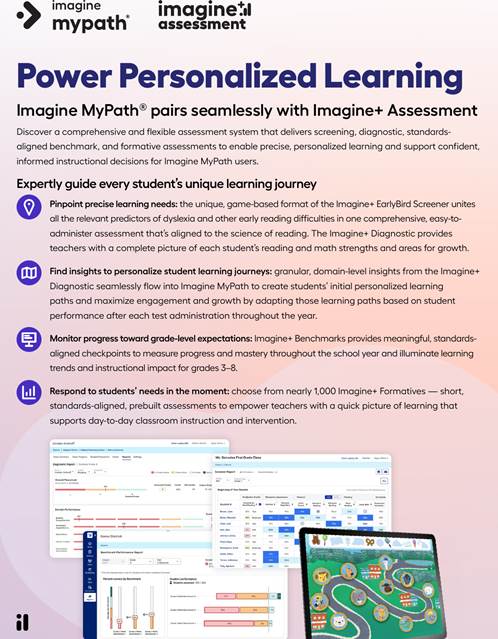
In the Imagine Learning ecosystem, Imagine+ Diagnostic can use domain-level data to support placement and adjustment of individualized learning paths in Imagine MyPath Math, Imagine MyPath Reading and Imagine Language & Literacy. This is a point worth considering for schools using or planning to use these programs. However, the ability to integrate with systems external to Imagine Learning needs to be separately confirmed during the engineering and pilot phase.
A small pilot process before making a buying decision
Instead of implementing the whole school immediately after a demo session, the school should test in a small enough area to control but real enough to evaluate the quality of decisions after assessment. A pilot can be organized according to the following steps:
1. Choose a grade or a group of classes with clear needs, such as a multi-level class, a class that needs to determine a starting point, or a block preparing to adjust the program.
2. Determine pilot questions before opening the system: does the school want to test the ability to detect vulnerabilities, divide groups, monitor growth, reduce grading time or improve communication with parents?
3. Set a baseline for current work load: time to create assignments, organize tests, grade, compile reports and prepare data meetings.
4. Organize an assessment window with unified procedures for equipment, instructions, accommodation, completion, and handling cases where students do not take their assignments seriously.
5. Requires teachers to use data to make at least one specific decision, such as dividing reteach groups, changing pacing, assigning intervention or enrichment.
6. After a cycle of teaching and testing, compare decision quality, student change, and teacher feedback before expanding.
Which KPIs should be measured in the pilot?
KPI should not just be a student's average score. A good pilot needs to measure both data quality, usability, and operating load. Schools can track the following indicators:
1. Percentage of students completing assessment on time and number of cases requiring reassignment or technical support.
2. Time from when the assessment ends until the teacher identifies the student group and priority skills.
3. Level of agreement between teachers on how to interpret domain, standard, proficiency category and growth.
4. Specific teaching decisions are made from data, rather than just saving reports or presenting scores.
5. Teachers save time in grading, synthesizing data and preparing for professional meetings.
6. Ability to explain results to parents in clear language, including strengths, needs and next steps for support.
7. The degree of agreement of the results with classroom observations and other sources of evidence. Assessment should supplement professional judgment, not completely replace teacher judgment.
List of questions to ask the supplier before buying
1. What grades, subjects and assessment types does the product support? What technical question is each type designed to answer?
2. Is Diagnostic adaptive, how long does it take and does the result go to overall score, domain or each standard?
3. What benchmark, norm, percentile, Lexile, Quantile or proficiency scale does the system use? How should schools interpret those indicators?
4. Are reports available at student, class, grade, school and system-wide levels? Who gets to see what data?
5. Teachers can assign lessons to individuals, groups and the whole class; Find assessments by skill or standard; see item-level data or not?
6. What languages and accommodations does the product support? Is there literature confirming the validity of the results for multilingual students?
7. Standards alignment applies to which framework? Is there a crosswalk with the curriculum the school is using?
8. What SIS, LMS, SSO and other learning programs does the system integrate with? Is there an API or data export in a usable format?
9. What are the device requirements, browser, headset, microphone, bandwidth and how to handle connection loss?
10. How does the supplier support setup, training, assessment calendar, data meeting and troubleshooting in the first year?
11. Where is the data stored, how long is it stored, is there a mechanism for decentralization, auditing and meeting the school's security requirements?
12. Pilot will be evaluated by what KPIs, will pilot data be retained when the school officially deploys and does the total cost include training, support, integration?
Is Image Assessment the right choice for your school?
Imagine+ Assessment is an option worth considering when schools need to combine multiple assessment purposes in one experience: Imagine+ Screener for early literacy PreK–3, adaptive Imagine+ Diagnostic for K–12 ELA and Math, and standards-based Imagine+ Formatives for K–8. The system provides reporting at multiple levels and directs data to decisions about placement, intervention, progress monitoring and personalized learning.
The most suitable score will depend on the school's curriculum, student language, technology system and current portfolio assessment. For schools using Imagine MyPath or Imagine Language & Literacy, the ability to connect data to support learning pathways is a clear advantage. For schools using curriculum or external systems, it is necessary to carefully evaluate standards mapping and data interoperability in the pilot instead of relying solely on product descriptions.
A valuable demo shouldn't just showcase the dashboard. The school should ask the vendor to simulate a real process: create an assessment window, students do the assignment, teachers view the domain/standard, the curriculum coordinator views the school-level report, and the whole group agrees on a next action. This is the fastest way to know if the software is actually improving decision quality or just creating an additional source of data.
Register for a free Trial account, demo book, quote:
Schools and teachers, please contact BooksVN, the designated distributor of Imagine Learning, in charge of countries including Vietnam, Philippines, Malaysia, Singapore, Hong Kong, Indonesia, India, Bangladesh, Cambodia, Laos, Japan and Taiwan through the following channels:
Website: www.booksvn.com Email: cs@booksvn.com
Mobile/WhatsApp: +84-915 920 514
Facebook: https://web.facebook.com/BooksVNeBooksachNgoaiVanchinhhang
Zalo OA: https://zalo.me/2230563715259512406


.svg)